Pima Association of Governments produces maps to visualize data for regional decision making. Maps are generally based on data sets covering the entire region, or larger areas as applicable, for the public and PAG member jurisdictions to use in planning, researching and implementing projects to improve the mobility, sustainability and livability of the region.
The information provided on PAG’s maps is available on an “as-is” basis, and there are no warranties, express or implied, including, but not limited to, any warranties of merchantability or fitness for a particular purpose. PAG provides the information in good faith and has endeavored to create and maintain accurate data. The users of PAG maps and/or data are advised to use the information with caution and to independently verify accuracy.
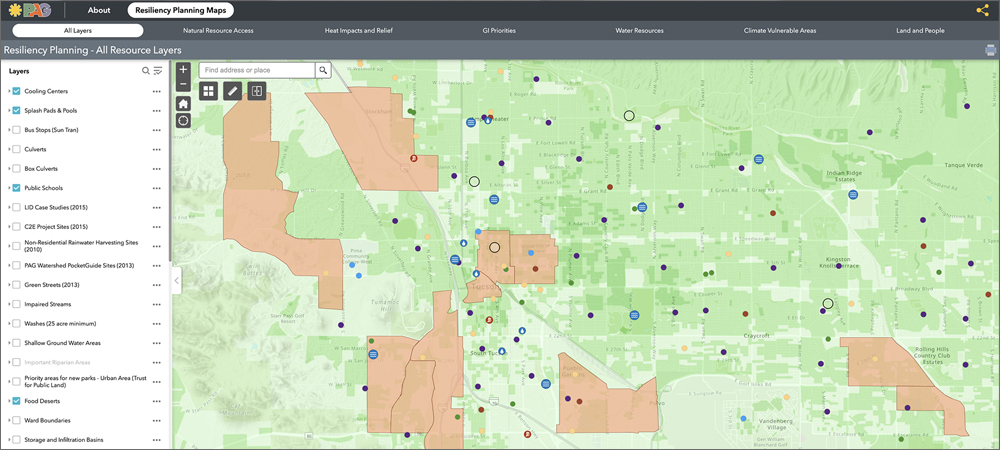
Interactive maps serve partners and residents
Many of PAG’s publicly available maps are interactive so users can explore, gather and compare data for specific needs. The interactive library of maps contains numerous products to help with regional planning and tools for public use, such as the Tucson Bike Map and the School Search Map.
Find all PAG interactive maps on one page, then explore them individually.
To order or utilize PAG’s regional Orthophotography and LiDAR data, please visit the Data page.
Maps support regional planning
Some maps are available as part of planning documents, such as area-of-service maps for every human services transit provider, found in the Public Transit-Human Services Coordinated Transportation Plan.
PAG prepares the region’s five-year funding program of construction projects, called the Transportation Improvement Program (TIP). In addition to information about the project scope and funding sources, the TIP includes maps as visual examples of the program of work.
PAG also produces maps to comply with Title VI, illustrating large concentrations of a specific race, ethnicity or vulnerable population to demonstrate how the distribution of transportation projects in the FY 2022-2026 TIP are equitable for each of those protected populations.
Additionally, the TIP projects themselves are mapped by the year they are programmed.