
Pima Association of Governments compiled the following economic snapshots to provide a brief overview of the region’s population, air quality measures and other regional data sources. If you have data inquiries regarding regional mobility, livability or sustainability, please contact us at info@pagregion.com.
Population Growth and Age Breakdown
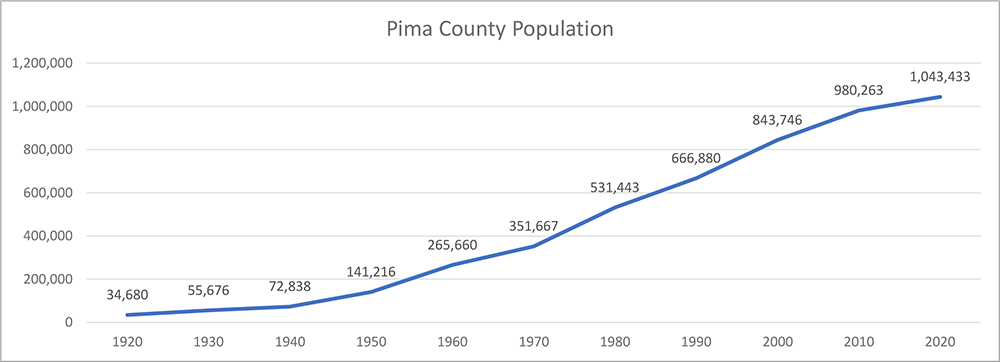
The greater Tucson region is rich with a diversity of people, businesses and opportunities for growth and economic development. Though the once-rapid pace of growth in the Tucson metropolitan area in the early-to-mid 2000s has slowed, Arizona remains one of the top five fastest growing states in the country. Pima County is no stranger to that growth and the challenges, opportunities and changes it can bring: the county’s population has consistently expanded in the past 100 years according to U.S. Census data.
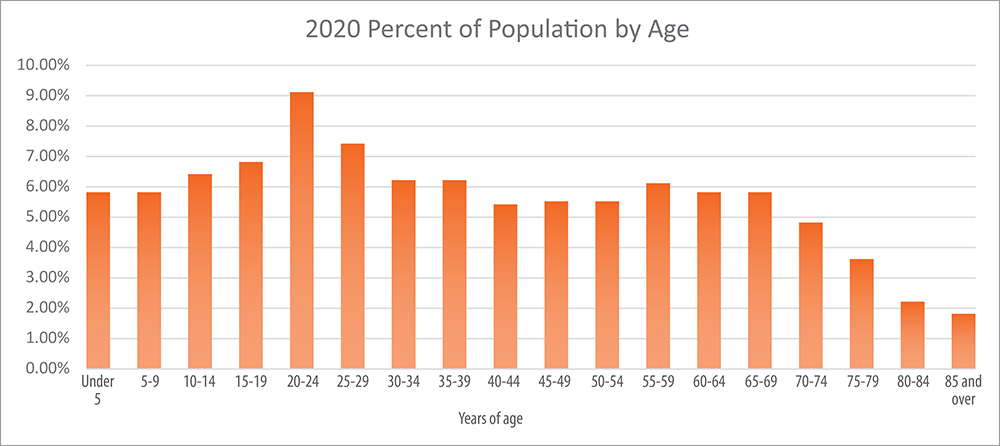
A region’s economic vitality can be dependent on the population spread by age. The group with the highest percentage of the population was males and females in the 20 to 24 age group in the 2020 Census.
Air quality + mobility, sustainability, livability
Regional factors contributing to the region’s economic vitality include the three areas of primary focus at PAG: mobility, sustainability and livability.
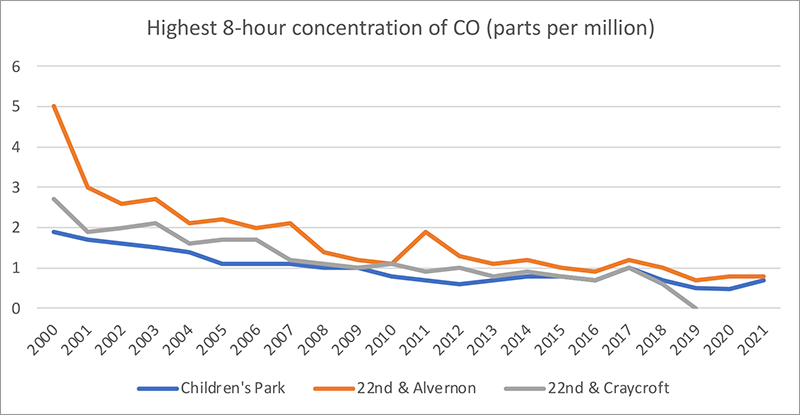
We work with the Pima County Department of Environmental Quality as a partner in air quality monitoring and maintaining regional standards. The Pima County monitoring stations show we stay well below the standard for carbon monoxide, which is 9 parts per million in an 8-hour average concentration. The metro area’s carbon monoxide emissions have been going down since the turn of the century.
The region has a different challenge with ozone standards. Ozone is created when certain chemicals, such as those from vehicles or manufacturing activities, combine with heat and sunlight. Predictably, southern Arizona’s soaring summer temperatures can cause an increase in ozone and lead to air quality warnings for those sensitive to poorer air quality.
The current standard is not to exceed .07 parts per million in an 8-hour average concentration. The region’s data for the past 20 years shows the higher reaches of the average tend to hoover between .06 and .07 parts per million, making it a pollutant we all need to help reduce. PAG sponsors a Travel Reduction Program to help the region’s employers help their workforce reduce individual, solo car trips to the workplace in an effort to improve emissions and overall air quality.
Miles driven and fuel options
According to the EPA MOVES modeling for Pima County in 2020, total regionwide vehicles miles traveled was 7.4 billion. As noted above, vehicle emissions can contribute to air quality concerns such as ozone and carbon monoxide.
We do not have data on how many of those miles are accomplished in alternatively fueled vehicles, though we do know that they are a strategy in the complex array of options for reducing harmful emissions.
PAG is taking steps to prepare southern Arizona and the state for an expansion of alternative fuel stations. PAG participated in an Alternative Fuels Corridor Deployment Plan and hosts a national Alternative Fuels Station Locator map to help consumers and businesses plan travel.
Other sources of regional data
Regional census data is a good source of information, as Pima Association of Governments’ efforts to ensure participation in the 2020 Census were lauded for bringing in a higher-than-national-average response rate. In addition, PAG has compiled numerous other data sets for use in interactive maps and transportation planning.
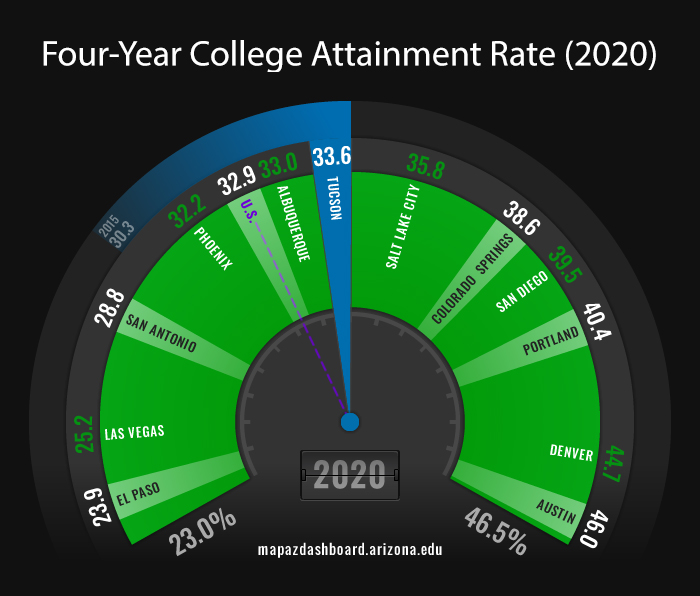
Another resource center is the University of Arizona Eller College of Management’s Making Action Possible (MAP) Dashboard. Pima Association of Governments is a funding partner and member of the MAP Dashboard advisory board.
“As a sponsor of the MAP Dashboard, PAG supports efforts to improve southern Arizona through data-sharing and education. The data provided by the MAP Dashboard aligns with PAG’s vision to improve the region’s mobility, sustainability and livability,” said PAG Executive Director Farhad Moghimi.
The dashboard shows data such as housing market and affordability, educational attainment rates and student achievement, cost of living, housing cost burden, and more. Each data set is explained and compared to other cities in the southwestern United States.
The dashboard is populated with 36 regional indicators in the following subject areas:
Economy
Education
Health & Social Well-Being
Infrastructure
Quality of Place
Workforce & Demographics